library(tidyverse)
library(janitor)
library(ggplot2)
library(here)
library(DHARMa)
library(ggeffects)
# read in packages This is a sample of my code from my personal data project for my Environmental Statistics class! I coded a plot of my data to show each data point given on hours of sleep on the x-axis (predictor variable) and stress level on the y-axis (response variable).
p_data <- read.csv(here("posts", "code", "Personal_Data.csv"))

clean_p_data <- p_data |> # create new data frame
  clean_names() # standardizes column names - spaces = underscores, make everything lowercase

clean_p_data <- clean_p_data |>
  mutate(amount_of_sleep = str_trim(amount_of_sleep),  # remove inconsistencies among group names
         amount_of_sleep = str_to_lower(amount_of_sleep))    # make lowercase if needed

clean_p_data <- clean_p_data |>  # modify data frame
  mutate(amount_of_sleep = fct_relevel(amount_of_sleep,
                                       "5 hrs", "6 hrs", "7 hrs",
"8 hrs", "9 hrs", "10 hrs")) # reorder data so that it is represented in numerical orderggplot(data = clean_p_data, # data frame
aes(x = amount_of_sleep, # make x-axis = amount of sleep
y = stress_level, # make y-axis = stress level
color = amount_of_sleep)) + # color
geom_jitter(width = 0.2, height = 0, alpha = 0.7) + # add jitter to show all data points
labs(
title = "Sleep vs. Stress Levels", # change title
x = "Hours of Sleep", # change name of x axis
y = "Stress Level", # change name of y axis
color = "Amount of Sleep") # change name of legend 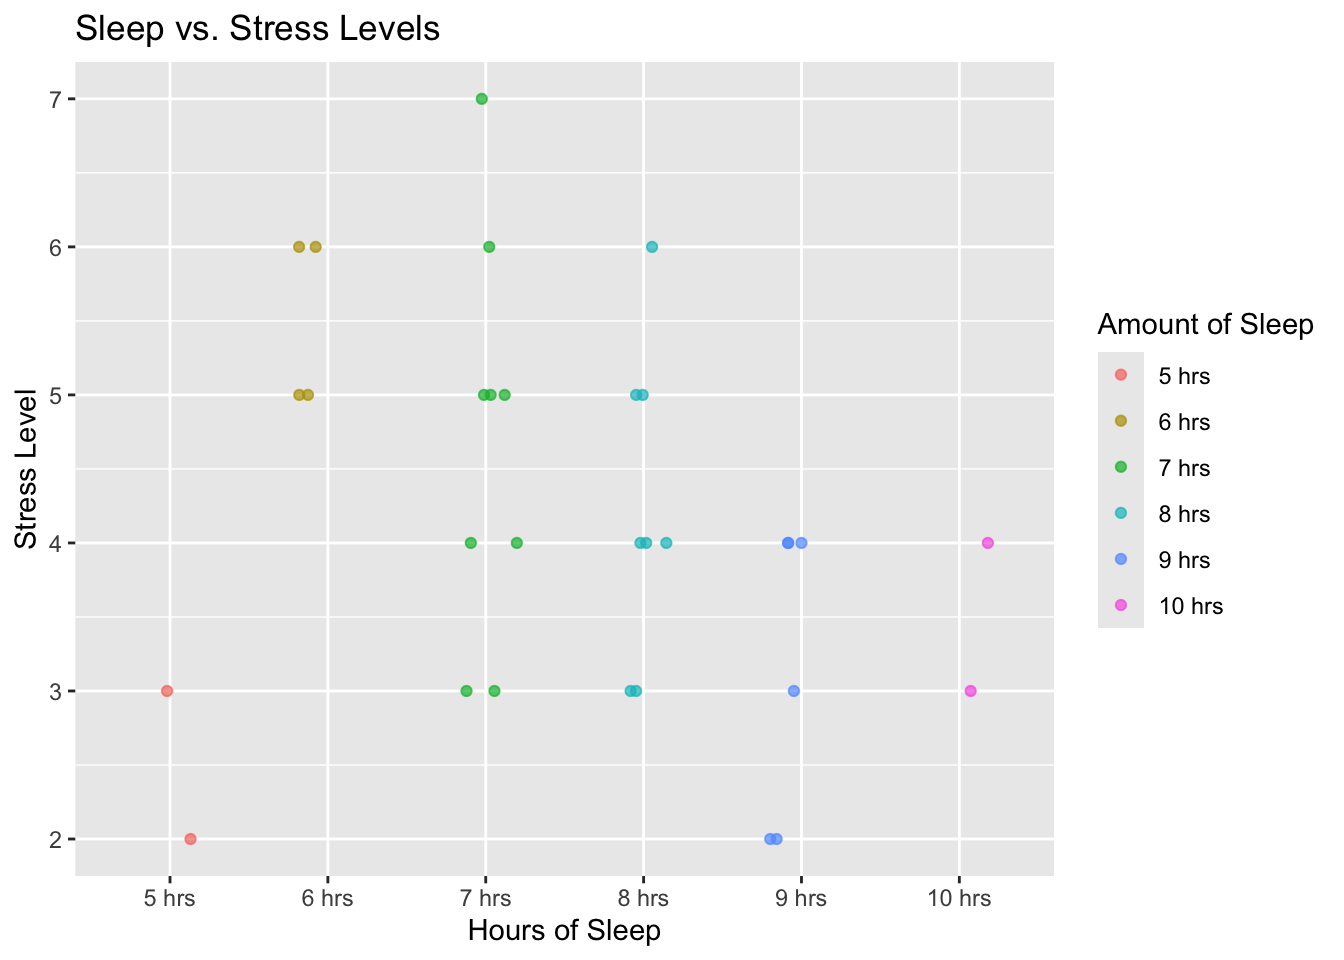
Additionally, I ran a logistic regression (a generalized linear model with a binomial error distribution) because my response variable is binary — the question of whether I left campus can be answered with either “yes” (coded as 1) or “no” (coded as 0). This model allowed me to test whether there is a correlation between my predictor (stress level) and my outcome (leaving campus).
I calculated the odds ratio, which tells me how the odds of leaving campus change with a one-unit increase in stress. The odds ratio was 1, indicating that stress level has no effect on the likelihood of leaving campus.
I confirmed this by looking at the predicted probabilities for different stress levels. Each level produced the same predicted probability, suggesting that stress has no statistically significant impact on the outcome.
Based on this analysis, I found no evidence of a correlation between stress level and the likelihood of leaving campus.
clean_p_data <- clean_p_data |> # data frame
mutate(leave_iv_campus_home = as.factor(leave_iv_campus_home)) # codes yes = 1, no = 0
p_mod <- glm(leave_iv_campus_home ~ stress_level, # creates model for linear regression
data = clean_p_data, # data frame
family = "binomial") # identifies model a binomial
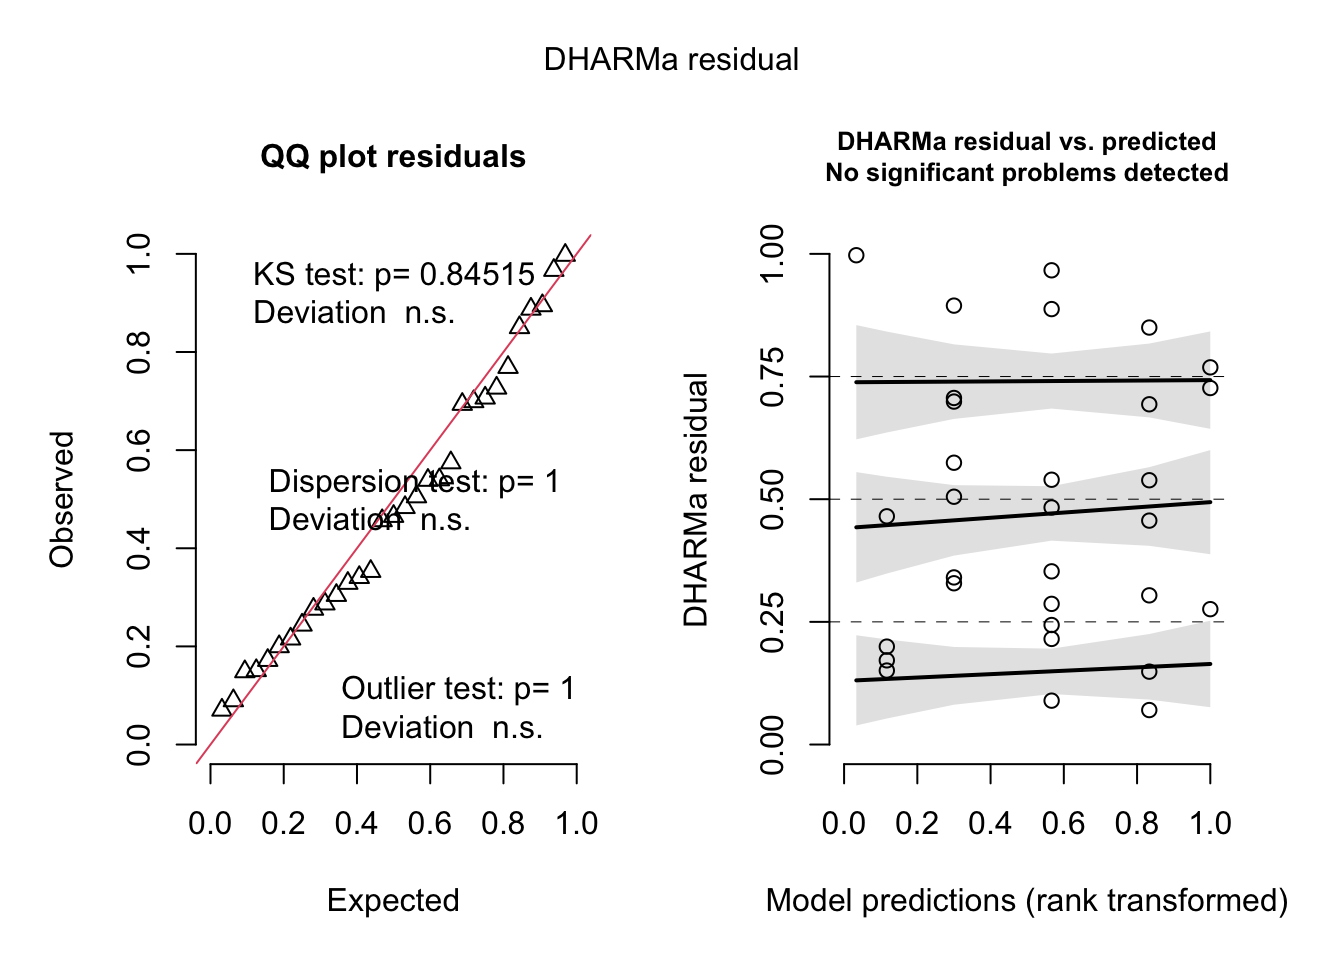
# Simulate and plot residuals
plot(
simulateResiduals(p_mod)
)
summary(p_mod) # gives summary of logistic regression model
Call:
glm(formula = leave_iv_campus_home ~ stress_level, family = "binomial",
    data = clean_p_data)

Coefficients:
              Estimate Std. Error z value Pr(>|z|)
(Intercept)   0.482079   1.261397   0.382    0.702
stress_level -0.005417   0.289748  -0.019    0.985

(Dispersion parameter for binomial family taken to be 1)

    Null deviance: 41.381  on 30  degrees of freedom
Residual deviance: 41.380  on 29  degrees of freedom
AIC: 45.38

Number of Fisher Scoring iterations: 4gtsummary::tbl_regression(p_mod,
exponentiate = TRUE) # exponentiates logistic regression model | Characteristic | OR | 95% CI | p-value |
|---|---|---|---|
| stress_level | 1.0 | 0.56, 1.78 | >0.9 |
| Abbreviations: CI = Confidence Interval, OR = Odds Ratio | |||
ggpredict (p_mod,
           terms = "stress_level [4]") # gives predicted probability for stress level = 4
# Predicted probabilities of leave_iv_campus_home
stress_level | Predicted | 95% CI
-------------------------------------
4 | 0.61 | 0.43, 0.77ggpredict(p_mod,
terms = "stress_level [5]") # gives predicted probability for stress level = 5# Predicted probabilities of leave_iv_campus_home
stress_level | Predicted | 95% CI
-------------------------------------
5 | 0.61 | 0.40, 0.79ggpredict(p_mod,
terms = "stress_level [6]") # gives predicted probability for stress level = 6# Predicted probabilities of leave_iv_campus_home
stress_level | Predicted | 95% CI
-------------------------------------
6 | 0.61 | 0.31, 0.85